
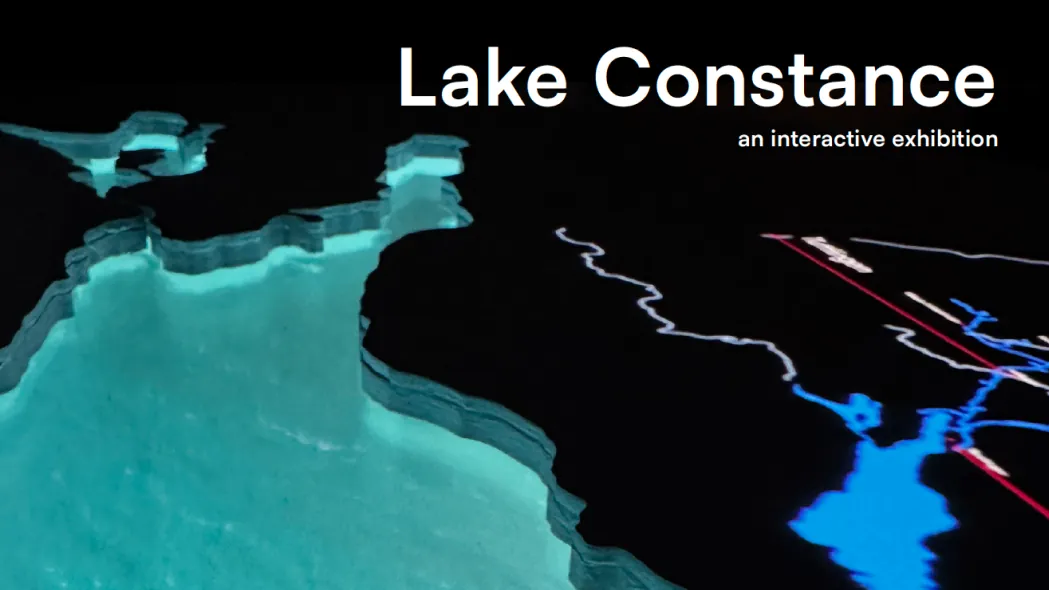
Case Study
Lake Constance – An interactive exhibition table that lets you get hands-on with Lake Constance
Lake Constance is an interactive exhibition table designed to make knowledge about Lake Constance accessible to a broad museum audience. The installation consists of a round table 1.40 m in diameter, a recessed display in which the lake glows, two projectors for the tabletop and five physical objects through which the content is unlocked.
- My Role
- Concept Interaction Design Technical Concept & IT Infrastructure Motion Design
- Team
- Carla KonradKlara RichterLuzian HäbeTobias Wallisch
- Context
- Interactive Communication Systems 2nd semester, HfG Schwäbisch Gmünd Supervised by Martin Wehl
Problem Statement
Regional data stays abstract as long as it only lives on text panels.
Around five million people get their drinking water from Lake Constance.[1] The Lake Constance Water Supply alone serves about 320 towns and municipalities, reaching as far as the Stuttgart region.[3] Exhibitions usually convey this connection through text panels or screens. But the longer a text is, the fewer visitors read it to the end: in an eye-tracking study, only half read an exhibit label of up to 100 words, and only a quarter one of up to 200 words.[5] Yet the audience ranges from school classes and families to international travellers, with very different backgrounds.
Guiding question
“How can we communicate regional data about Lake Constance so that people understand it without prior knowledge or long texts?”
Concept
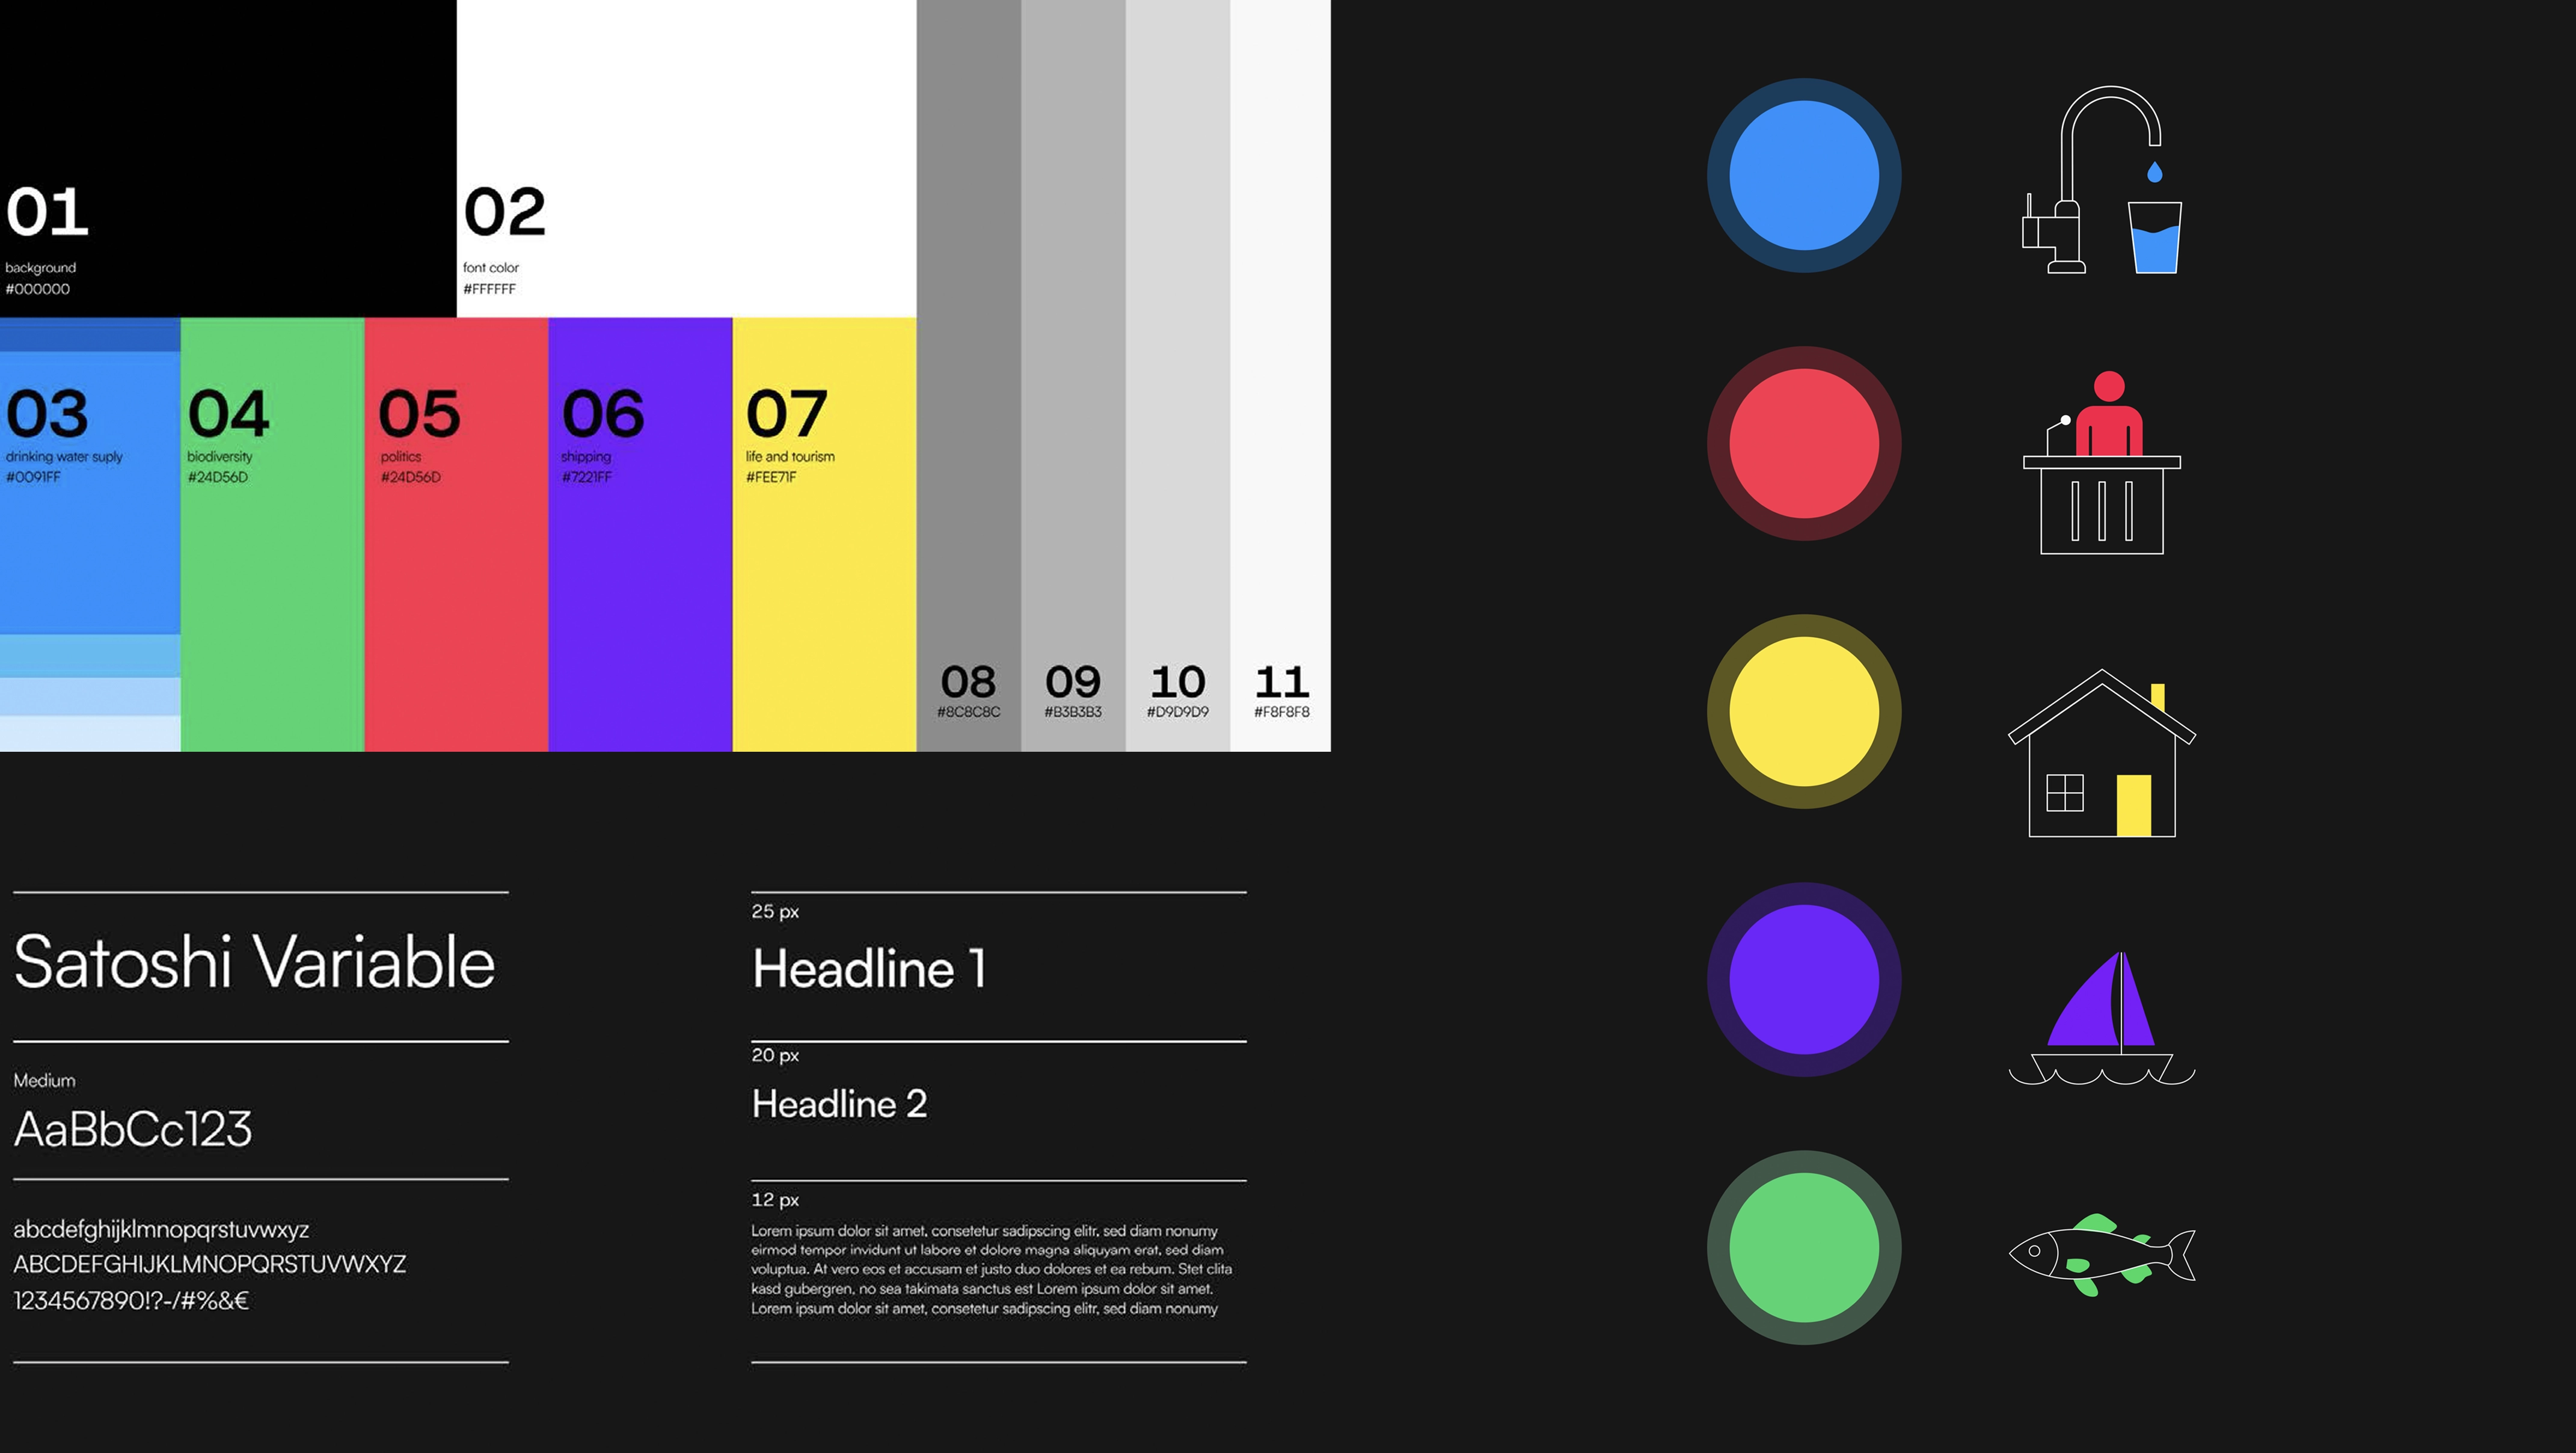
Lake Constance starts where traditional exhibitions reach their limits: text panels that hardly anyone reads to the end, and content that assumes prior knowledge. Instead of reading, you pick something up. The content is unlocked through five tangibles, one per topic. Lifting one selects a topic. Placing it on a projected position opens a piece of content. Because the lake sits at the centre and the content appears all around it on the table, people standing nearby can follow what's happening from every side.
In detail
01Research
Topic & context
We had the choice between human organs and lakes and groundwater. We chose lakes and groundwater, because a lake ecosystem allows ecological, social and political topics to sit side by side and so appeals to different interests and age groups. That led us to Lake Constance: Germany's largest lake, a holiday destination and a drinking water reservoir all at once. The installation is intended for a museum near the lake, with an audience ranging from school classes to international travellers. Because it works with projections, it needs a darkened room.
Content
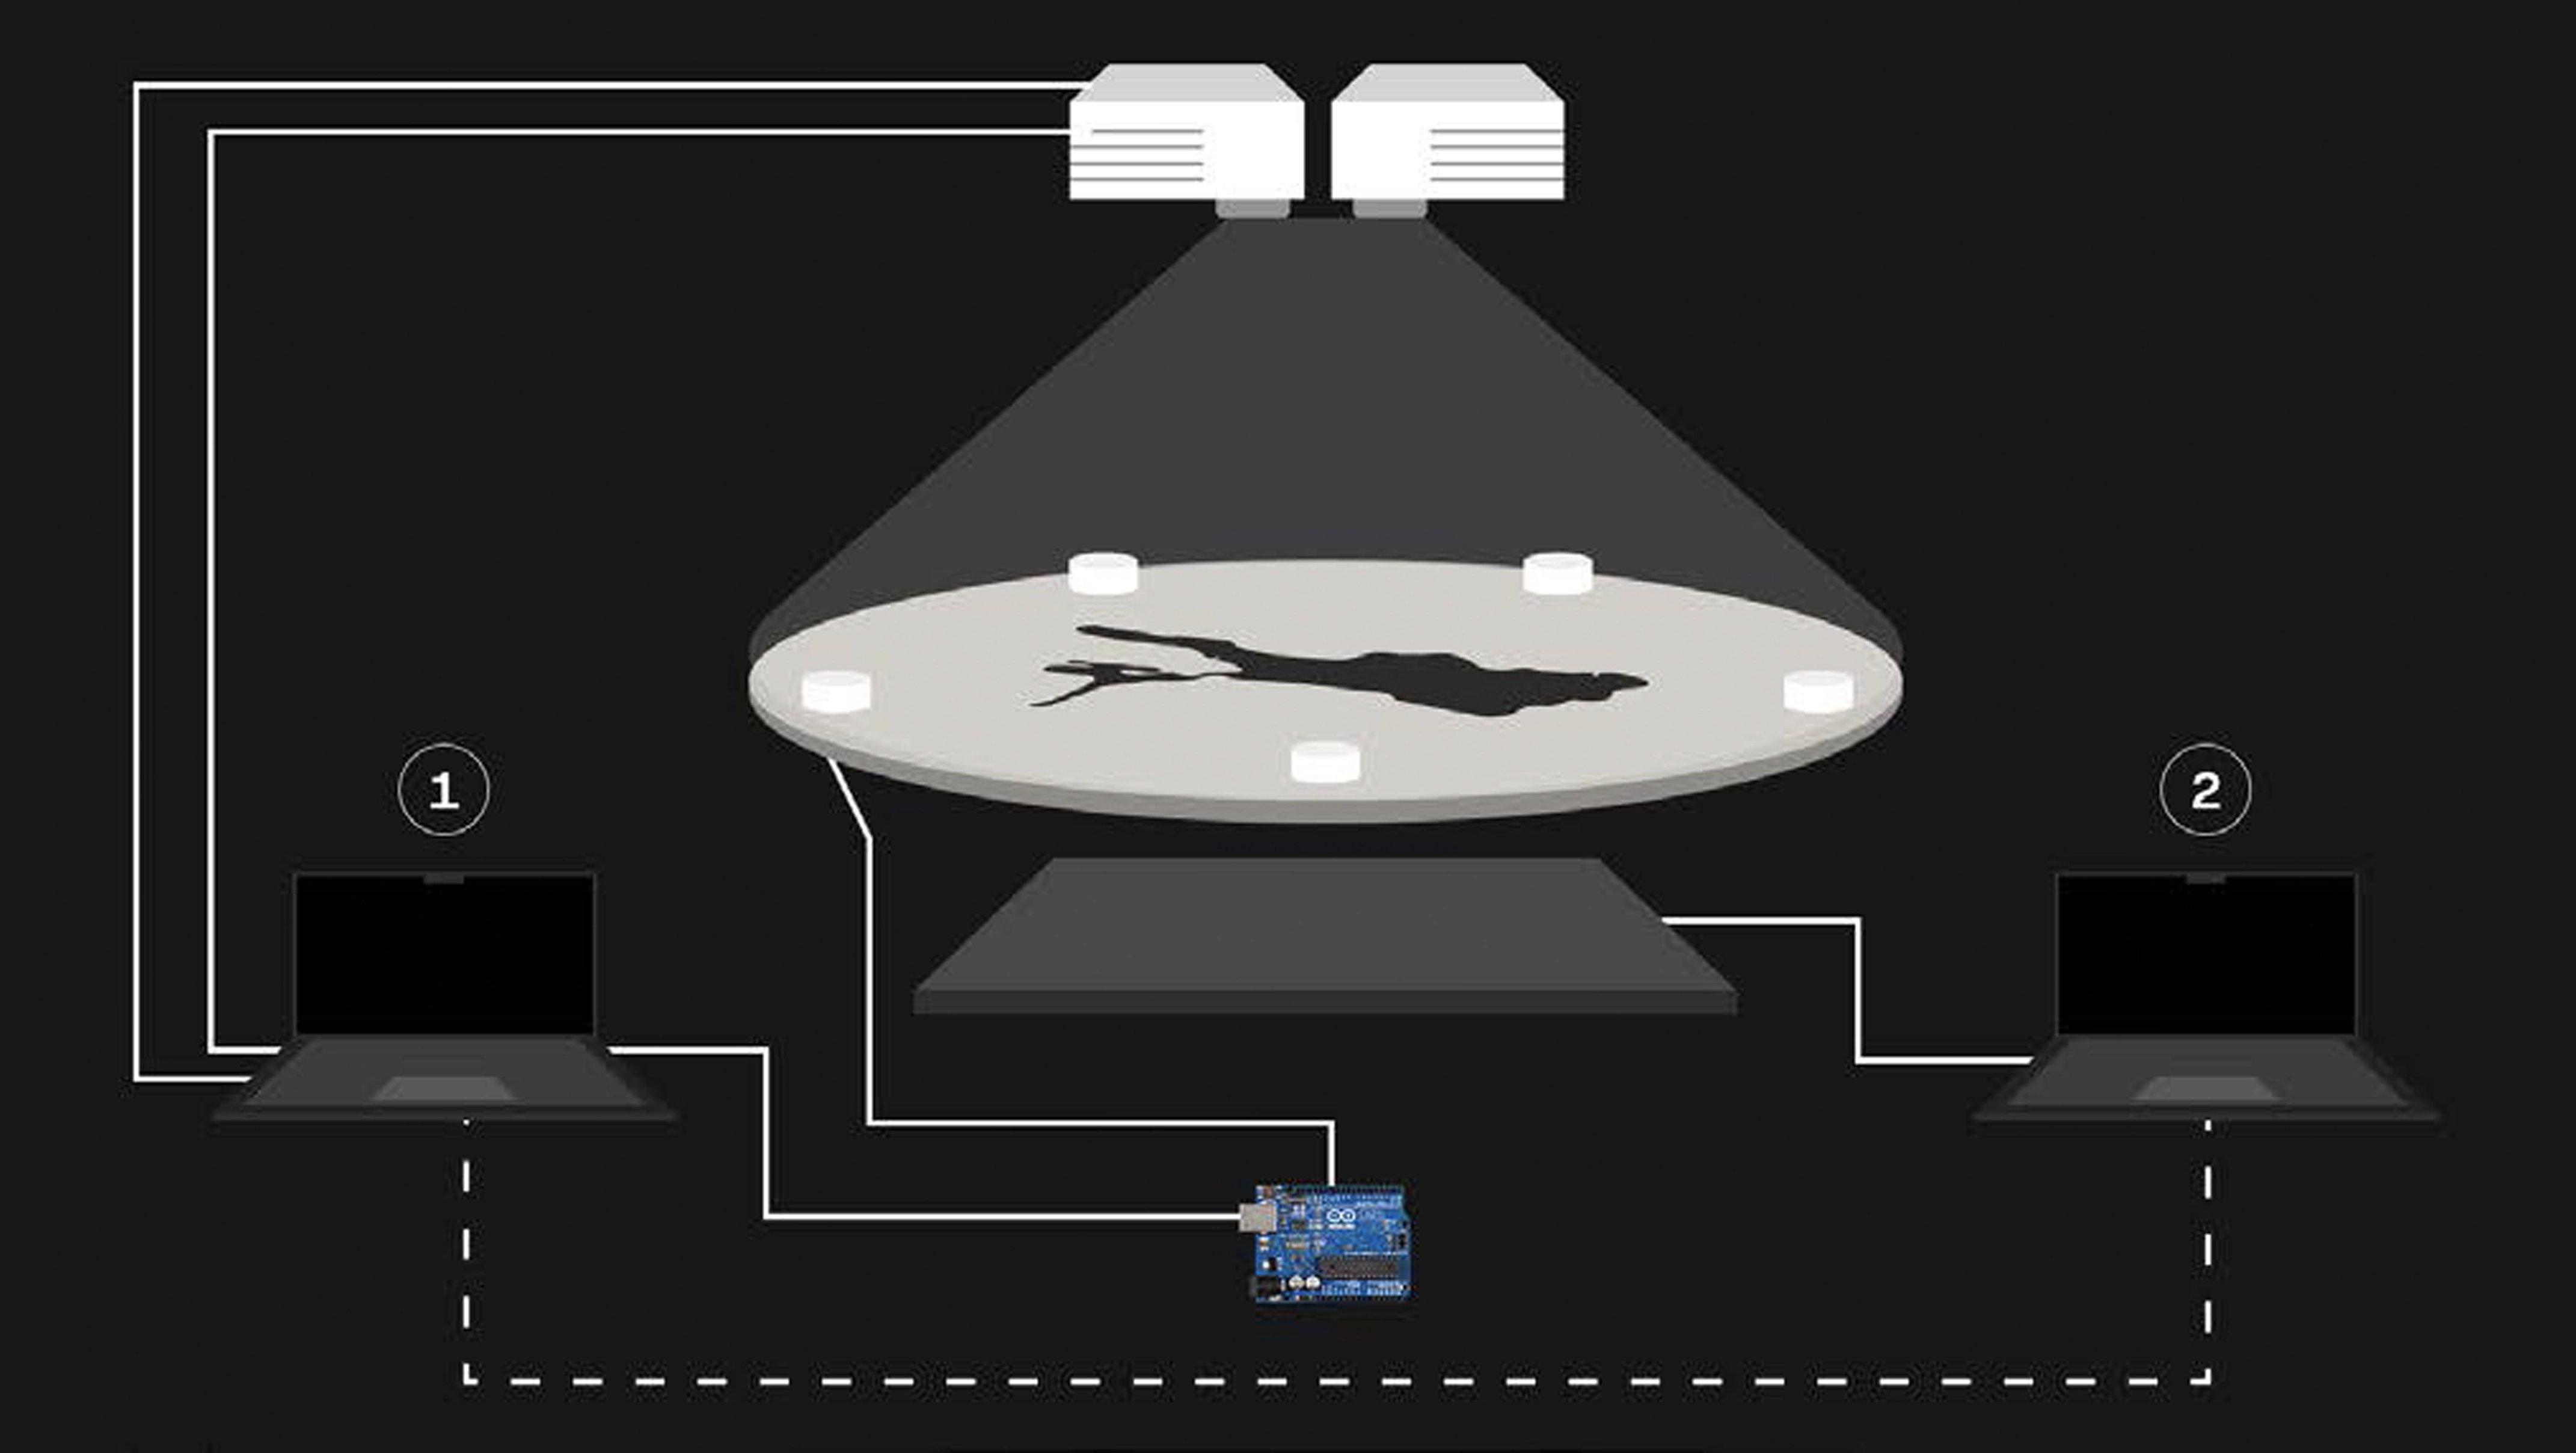
We split the research within the team and structured it with sticky notes. This resulted in five topics balancing ecology, society and politics: drinking water supply, politics, life and tourism, shipping, and biodiversity. For the prototype we focused on the drinking water supply. The Lake Constance Water Supply alone serves millions of people, reaching as far as the Stuttgart region. This direct connection between people and the lake was the best way to show what tangibles and animations can do.
Hand sketches of three table views with Lake Constance as a map and tangibles along the edge, next to a handwritten topic list on population, hotels, sights and boat trips. Sketch of a Lake Constance map with shoreline, cycle path, shipping routes, towns and info boxes with key figures, above a row of round topic fields. Sticky-note research on the topic choice for the Lake Constance project. Sticky-note research on the exhibition context and content of the Lake Constance project. Pile of hand-drawn drafts, including sketches of organ topics such as the lungs and blood circulation and notes on lakes and groundwater. 02Decisions
Round, not rectangular
A rectangular table or a screen on the wall sets a viewing direction: whoever stands right in front sees everything, whoever stands to the side sees much less. A round table has no front. The lake sits at the centre, and visitors can spread out around it and follow what's happening from every side. The table is operated with one tangible at a time, but it is watched and talked about together.
From rotating to placing
At first we wanted to navigate by rotating the table. But a single axis of rotation wasn't enough for five topics, each with several subtopics. A flow system with timed paths and moving elements was more dynamic, but felt too playful. That led us to tangibles: each topic gets its own physical object, and placing it becomes the input.
Hand sketch of the rotating table: projector from above, fixed projection surface with the Lake Constance model and a rotating ring for choosing the topic. Early prototype of the round Lake Constance table. Paths we abandoned
For the lake at the centre of the table, we first planned a layered wooden model, but projections from above would have distorted on the stepped layers. Opal acrylic on top would have hidden the model's details. A display under frosted glass failed because of the distance: either the projection was sharp or the topography. Clear acrylic caused strong reflections. In the end we left out every intermediate layer. The display sits directly in the table, the lake appears recessed and glows on its own in the dark room.
Getting the tangibles to snap into place also took two attempts. With several magnets and steel rings, the objects too often snapped into the wrong spot. The solution separates positioning from triggering: a small magnet in the tangible pulls it into the right position, and a wider magnet above it triggers the reed switch in the 3D-printed holder beneath the tabletop. We fine-tuned the distance in the holder over several iterations.
Projected depth map of Lake Constance near Meersburg with a frosted acrylic pane on a wooden strip: under the acrylic, the map turns blurry. Two hands hold a frosted acrylic tangible with 3D-printed pegs against a smartphone, with a blue projection with corner handles in the background. Acrylic glass material samples in many colours and finishes, plus a wavy, frosted acrylic sheet. 03Solution
How it works
On the start screen, you choose a topic by lifting the matching tangible. The possible placement positions then appear as a projection on the table, and placing the object starts the content. Lifting it again takes you back to the selection. Objects that can't be used at the moment lose their highlight. This way, the table shows what's possible through light alone.
Technology
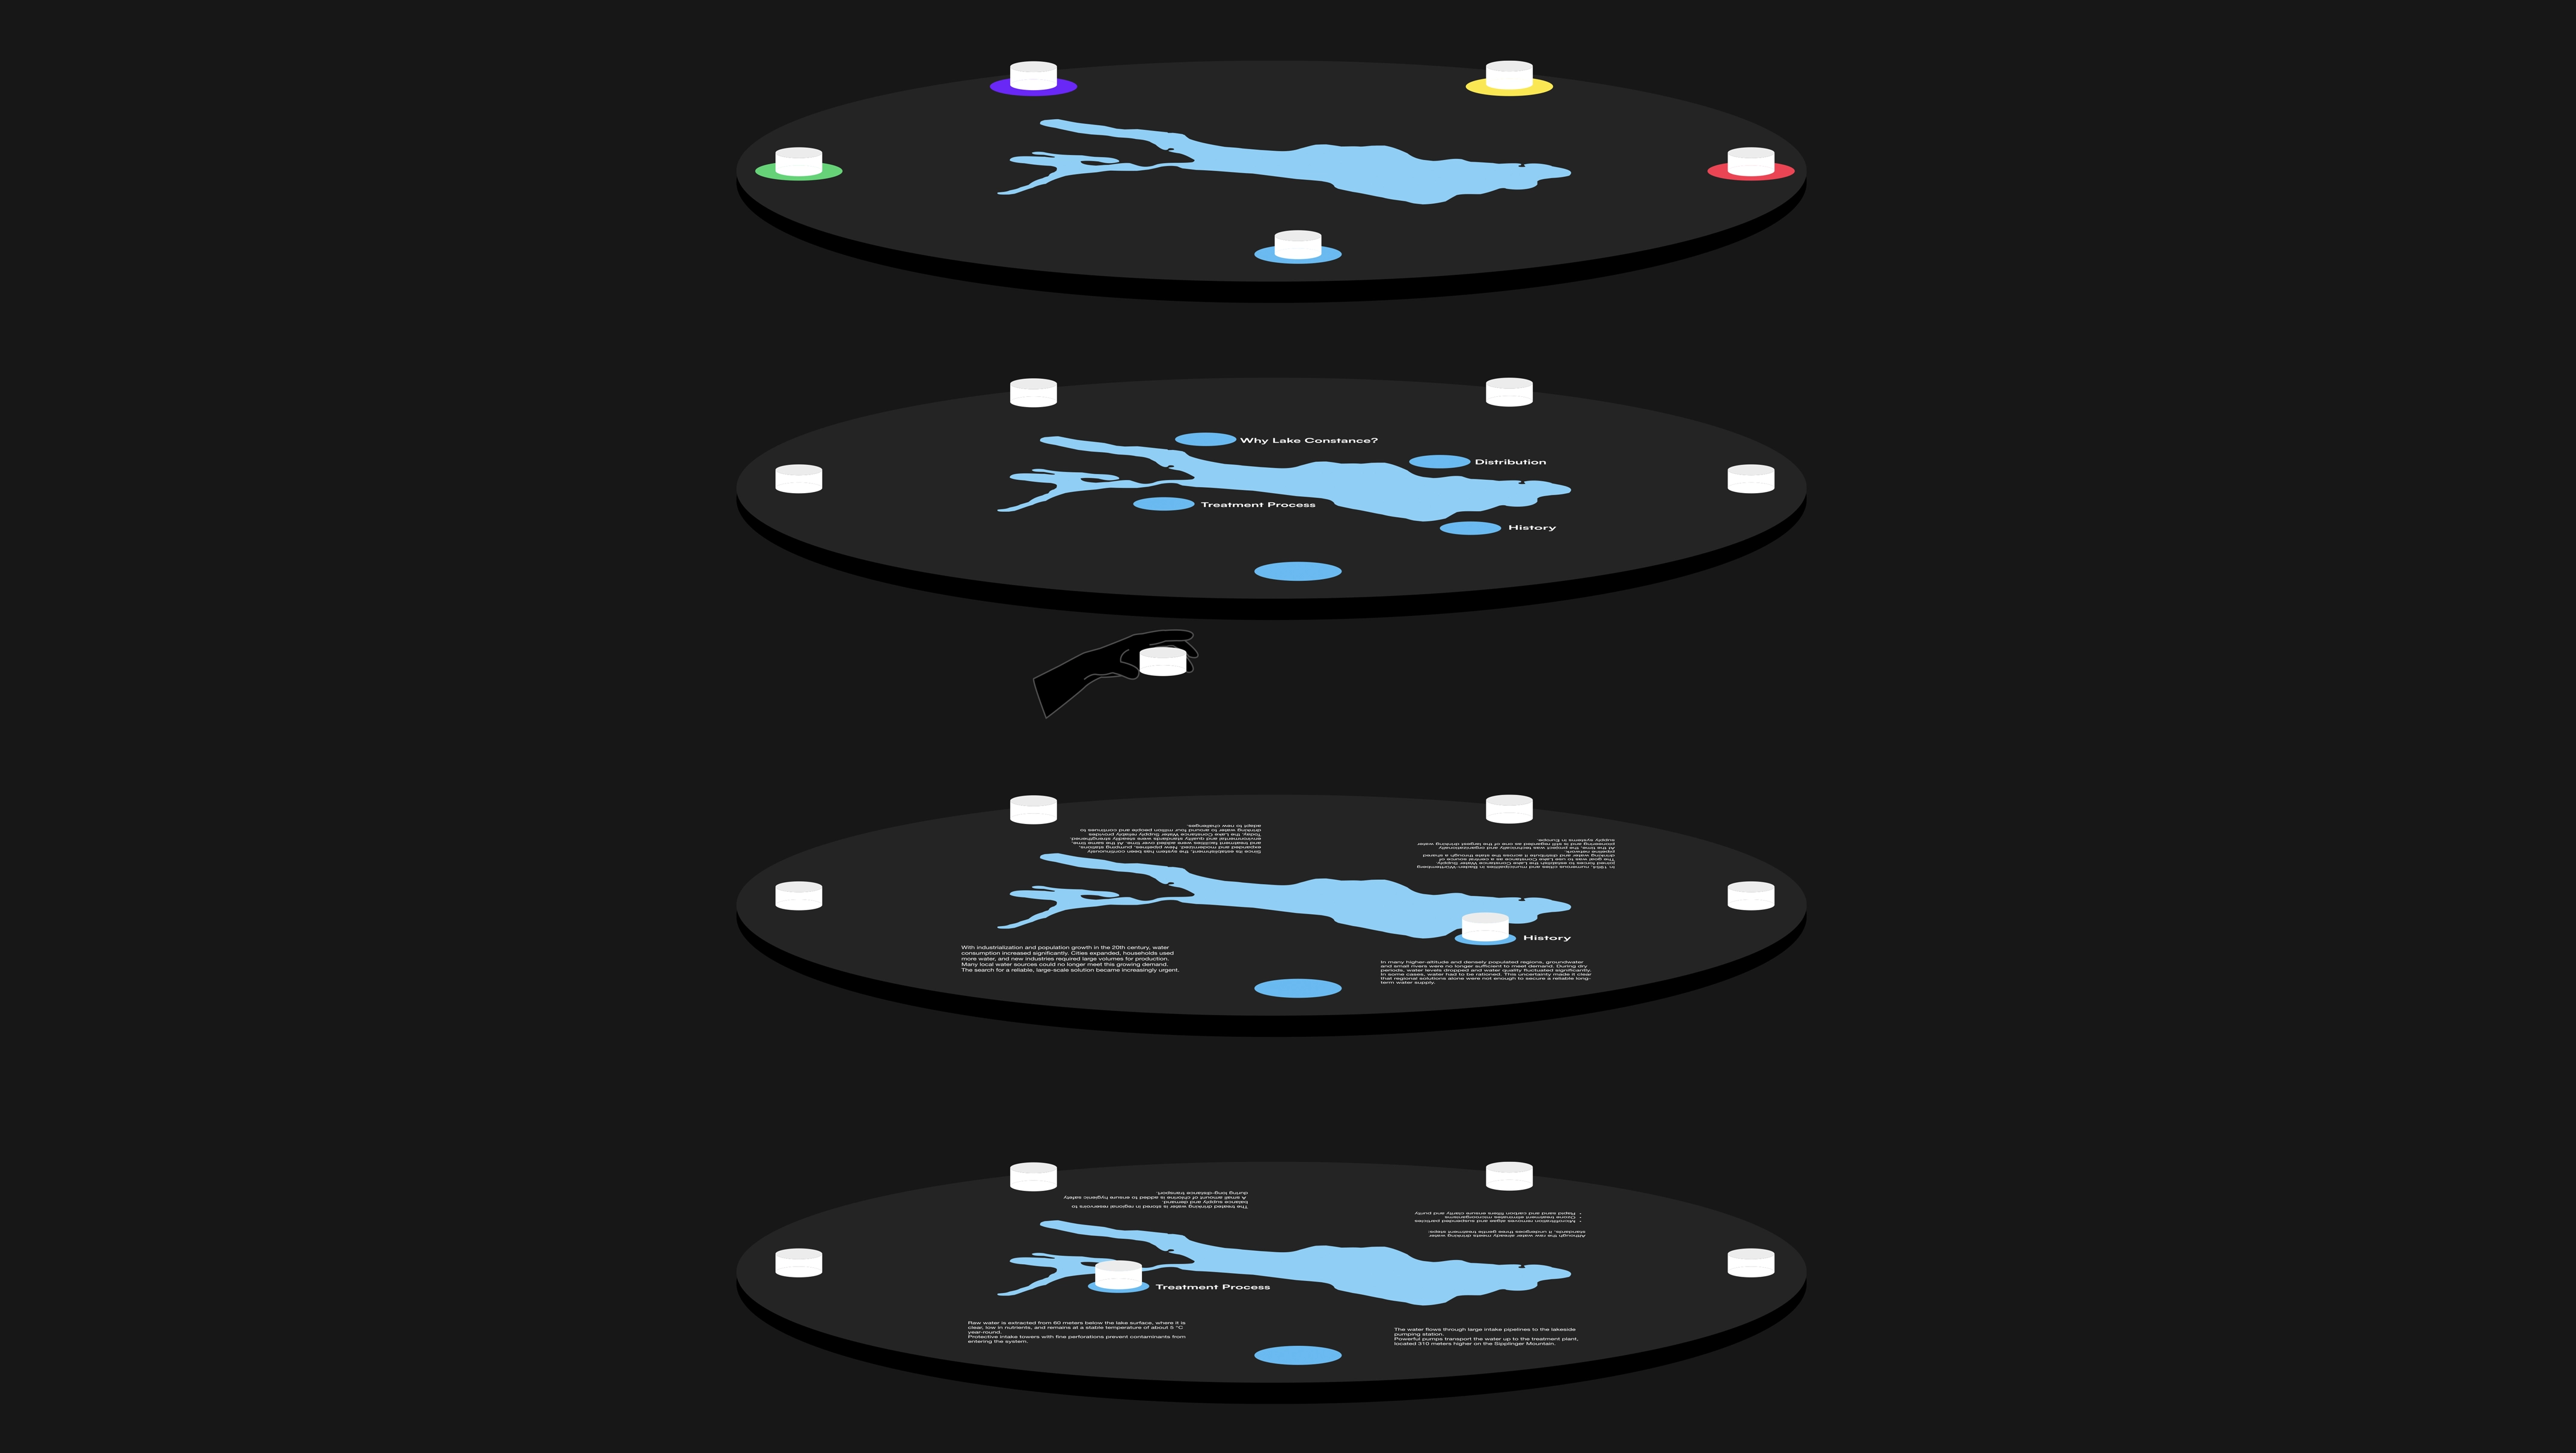
I developed the IT infrastructure; the technical concept was developed as a team. All reed switches feed into an Arduino, which passes the signals to a MacBook running projection-mapping software. That MacBook can only drive two external displays. So a second MacBook handles the lake display and receives the signals via WebSocket through a web app we programmed ourselves.
Design system
A dark theme makes the colours of the lake stand out in the darkened room, and each topic has its own highlight colour. The visual language is based on fine line art in a matter-of-fact, approachable style, set in Satoshi Variable. Pulsing drop zones show where an interaction is expected. I created the animations.
04Outcome
Outcome & learnings
The result is a working table 1.40 m in diameter, with a recessed lake display, two projectors, five tangibles and a fully developed topic strand on the drinking water supply. At the semester exhibition, we observed that visitors were able to use the table without any explanation.
Almost every important improvement came from a physical test. Next, we would develop the remaining four topics and connect the lake display and table projection more closely, for example with waves that travel from the lake across the whole table.
Exploded view of the finished table in layers: tangibles, tabletop with the lake outline, second board with cut-outs and wiring, wooden frame with display and base plate. Layered build of the table: tangibles with magnets, wooden boards, reed switch and 3D-printed holder. 0:00 / 0:00
Sources
- [1] IGKB (2024). Fact sheet on water extraction from Lake Constance, October 2024.
- [2] Wikipedia, "Lake Constance".
- [3] Zweckverband Bodensee-Wasserversorgung (Lake Constance Water Supply Association).
- [4] IGKB. Lake Constance data.
- [5] Reitstätter, L., Pesen, S. & Bakondi, F. (2026). We See as We Are Told? How Exhibit Labels Shape Art Perception in the Museum. Visitor Studies, 29(1). Mobile eye-tracking study.